Sustainable Mobility, infrastructures and performances
**
We were asked by Thalys, a transeuropean railway service, to design a full datavizualisation report based on a study carried out by our friends and partners at Carbone 4. Thalys wanted to compare its infrastructures and network performances with other transportation modes such as plane, car, bus and carpooling. We had to design the report for different targets, distinguishable by their exigence levels and their needs : business travellers and leisure travellers.
The report was focused on three essential aspects of a travel : time, costs and externalities (positive or negative such as pollution). Based on Carbone 4’s collected data, we designed powerful and meaningful infographics which have been used in the final report and the executive summary. The data have been collected from the entire Thalys’s network. For the sake of this article, we wanted to focus on a single itinerary : Paris-Amsterdam.
Time
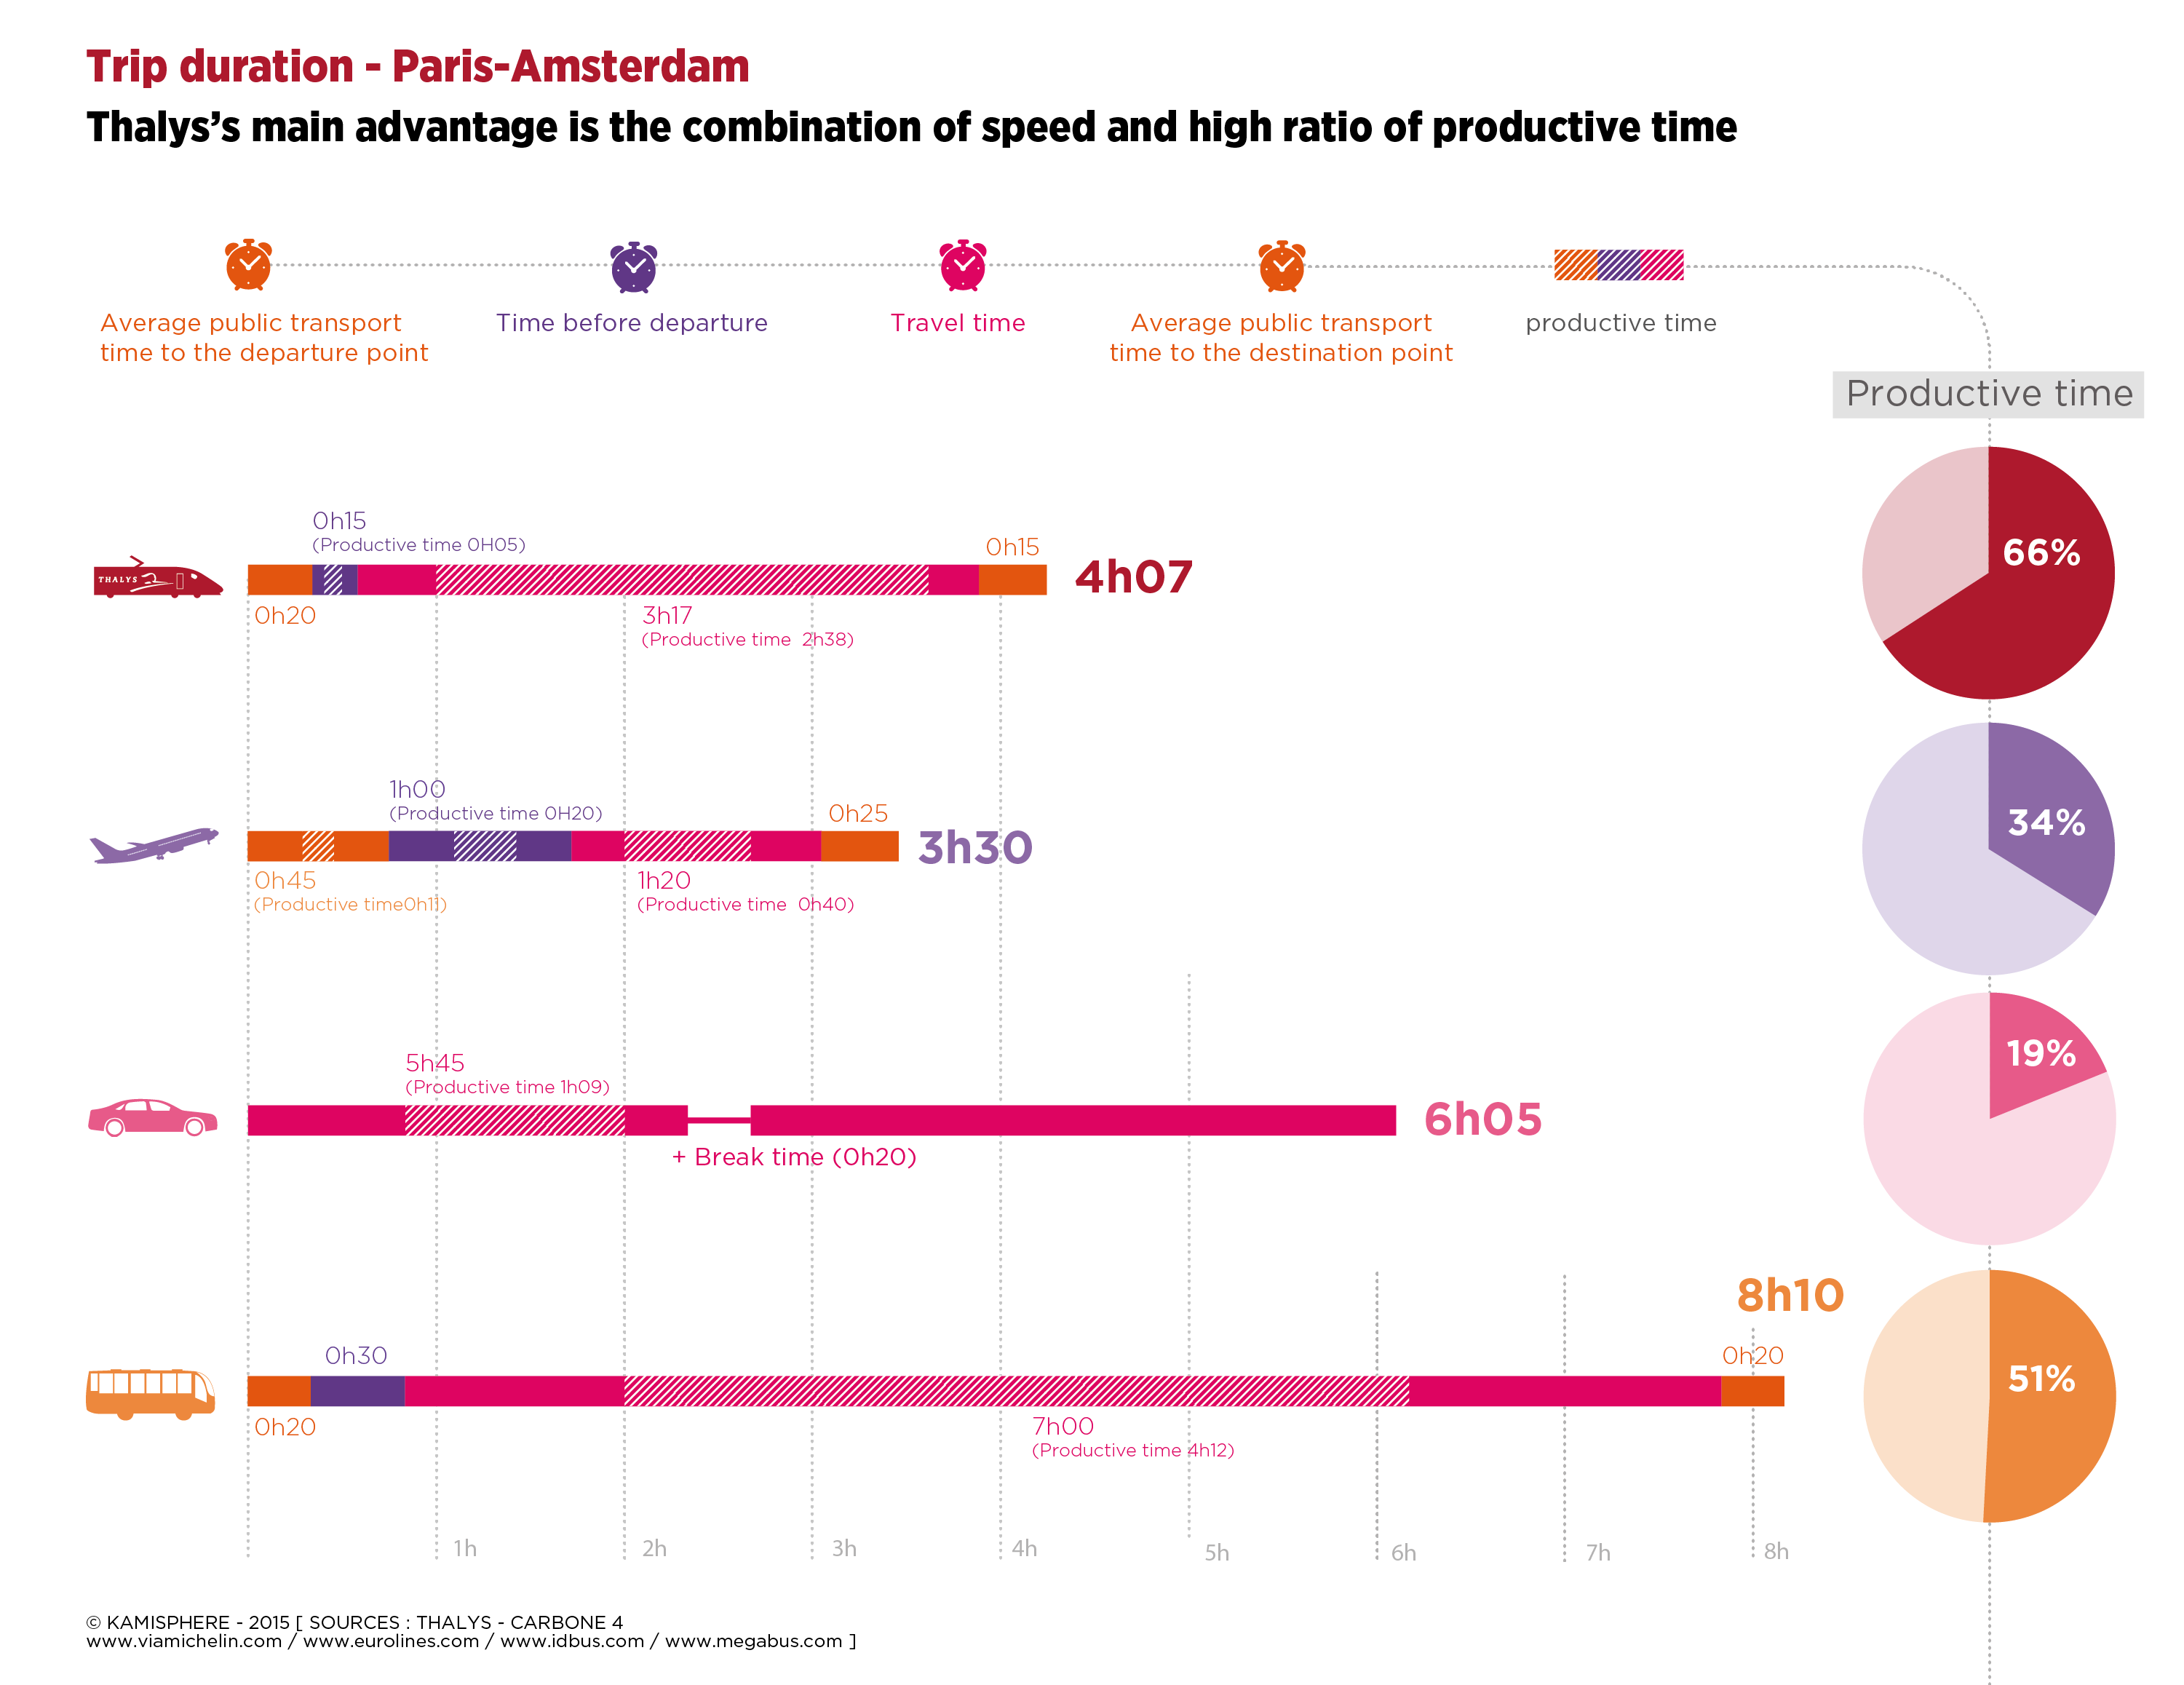
Time is an important dimension for business and leisure travellers. For business travellers, it has a huge impact on their productivity and their rentability. In other words, it has a direct impact on the economic field. We created a first infographic which compares time spent in different transport modes for the same itinerary. What we noticed is that each sequence in a journey is important. A shorter effective transport time doesn’t mean the whole travel is shorter. Our calculation took into account the boarding and commuting time for example. In this graphic, time is represented and quantified by the width of rectangle. Eyes can immediately spot the longest travel and compare different travel’s sequences.
We also added an information by comparing productive times for each transportation mode. A travel often means unproductive and wasted time for business travellers. It’s important for them to stay productive when travelling. We associated the total travel’s time and the total productive time. The data we had, clearly showed that Thalys is the best way to travel while staying productive.
© Kamisphère
Cost
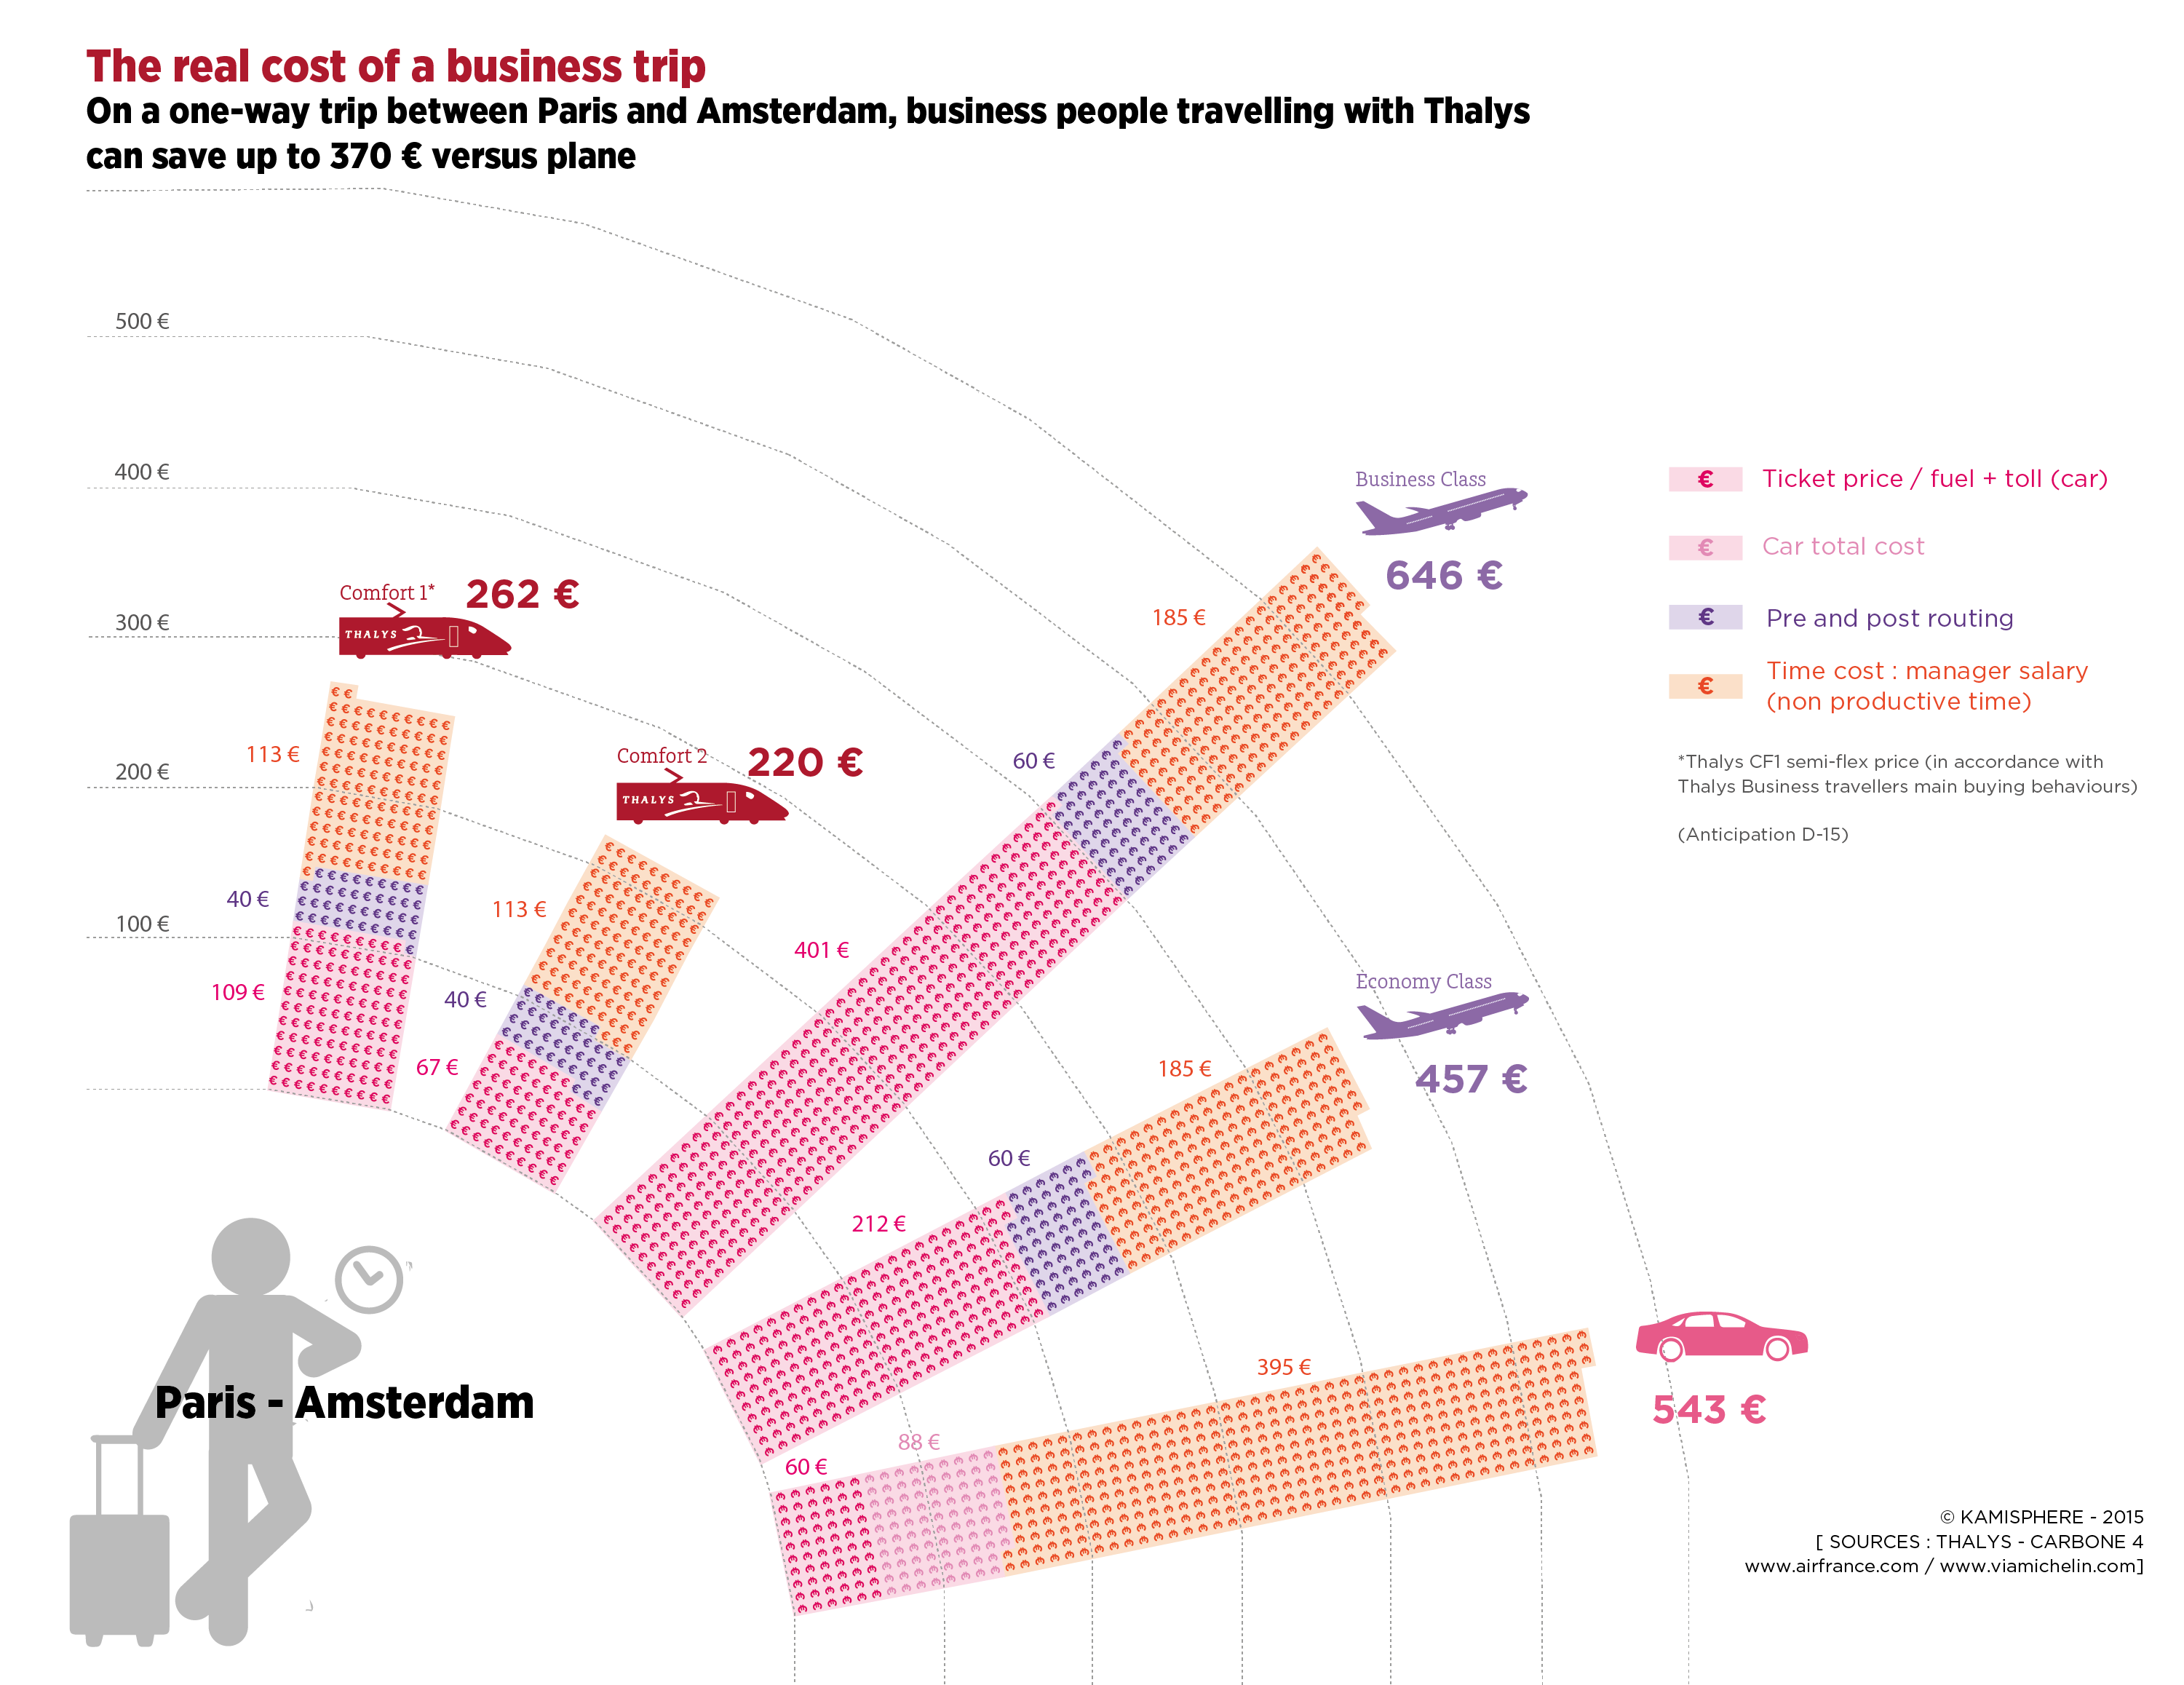
A popular adage says : “Time is money !” Longest travel times also means wasted money. For company and business travellers it’s no more than a matter of rentability and productivity. Our friends at Carbone 4 extracted, from the data, the travel cost for each transport mode, by decomposing the actual cost and the subsidiary time cost. Data and calculation methods were complex and not immediately intelligible. That’s why we designed a simple graphic with a clear suggestive pattern.
© Kamisphère
Occupation on board
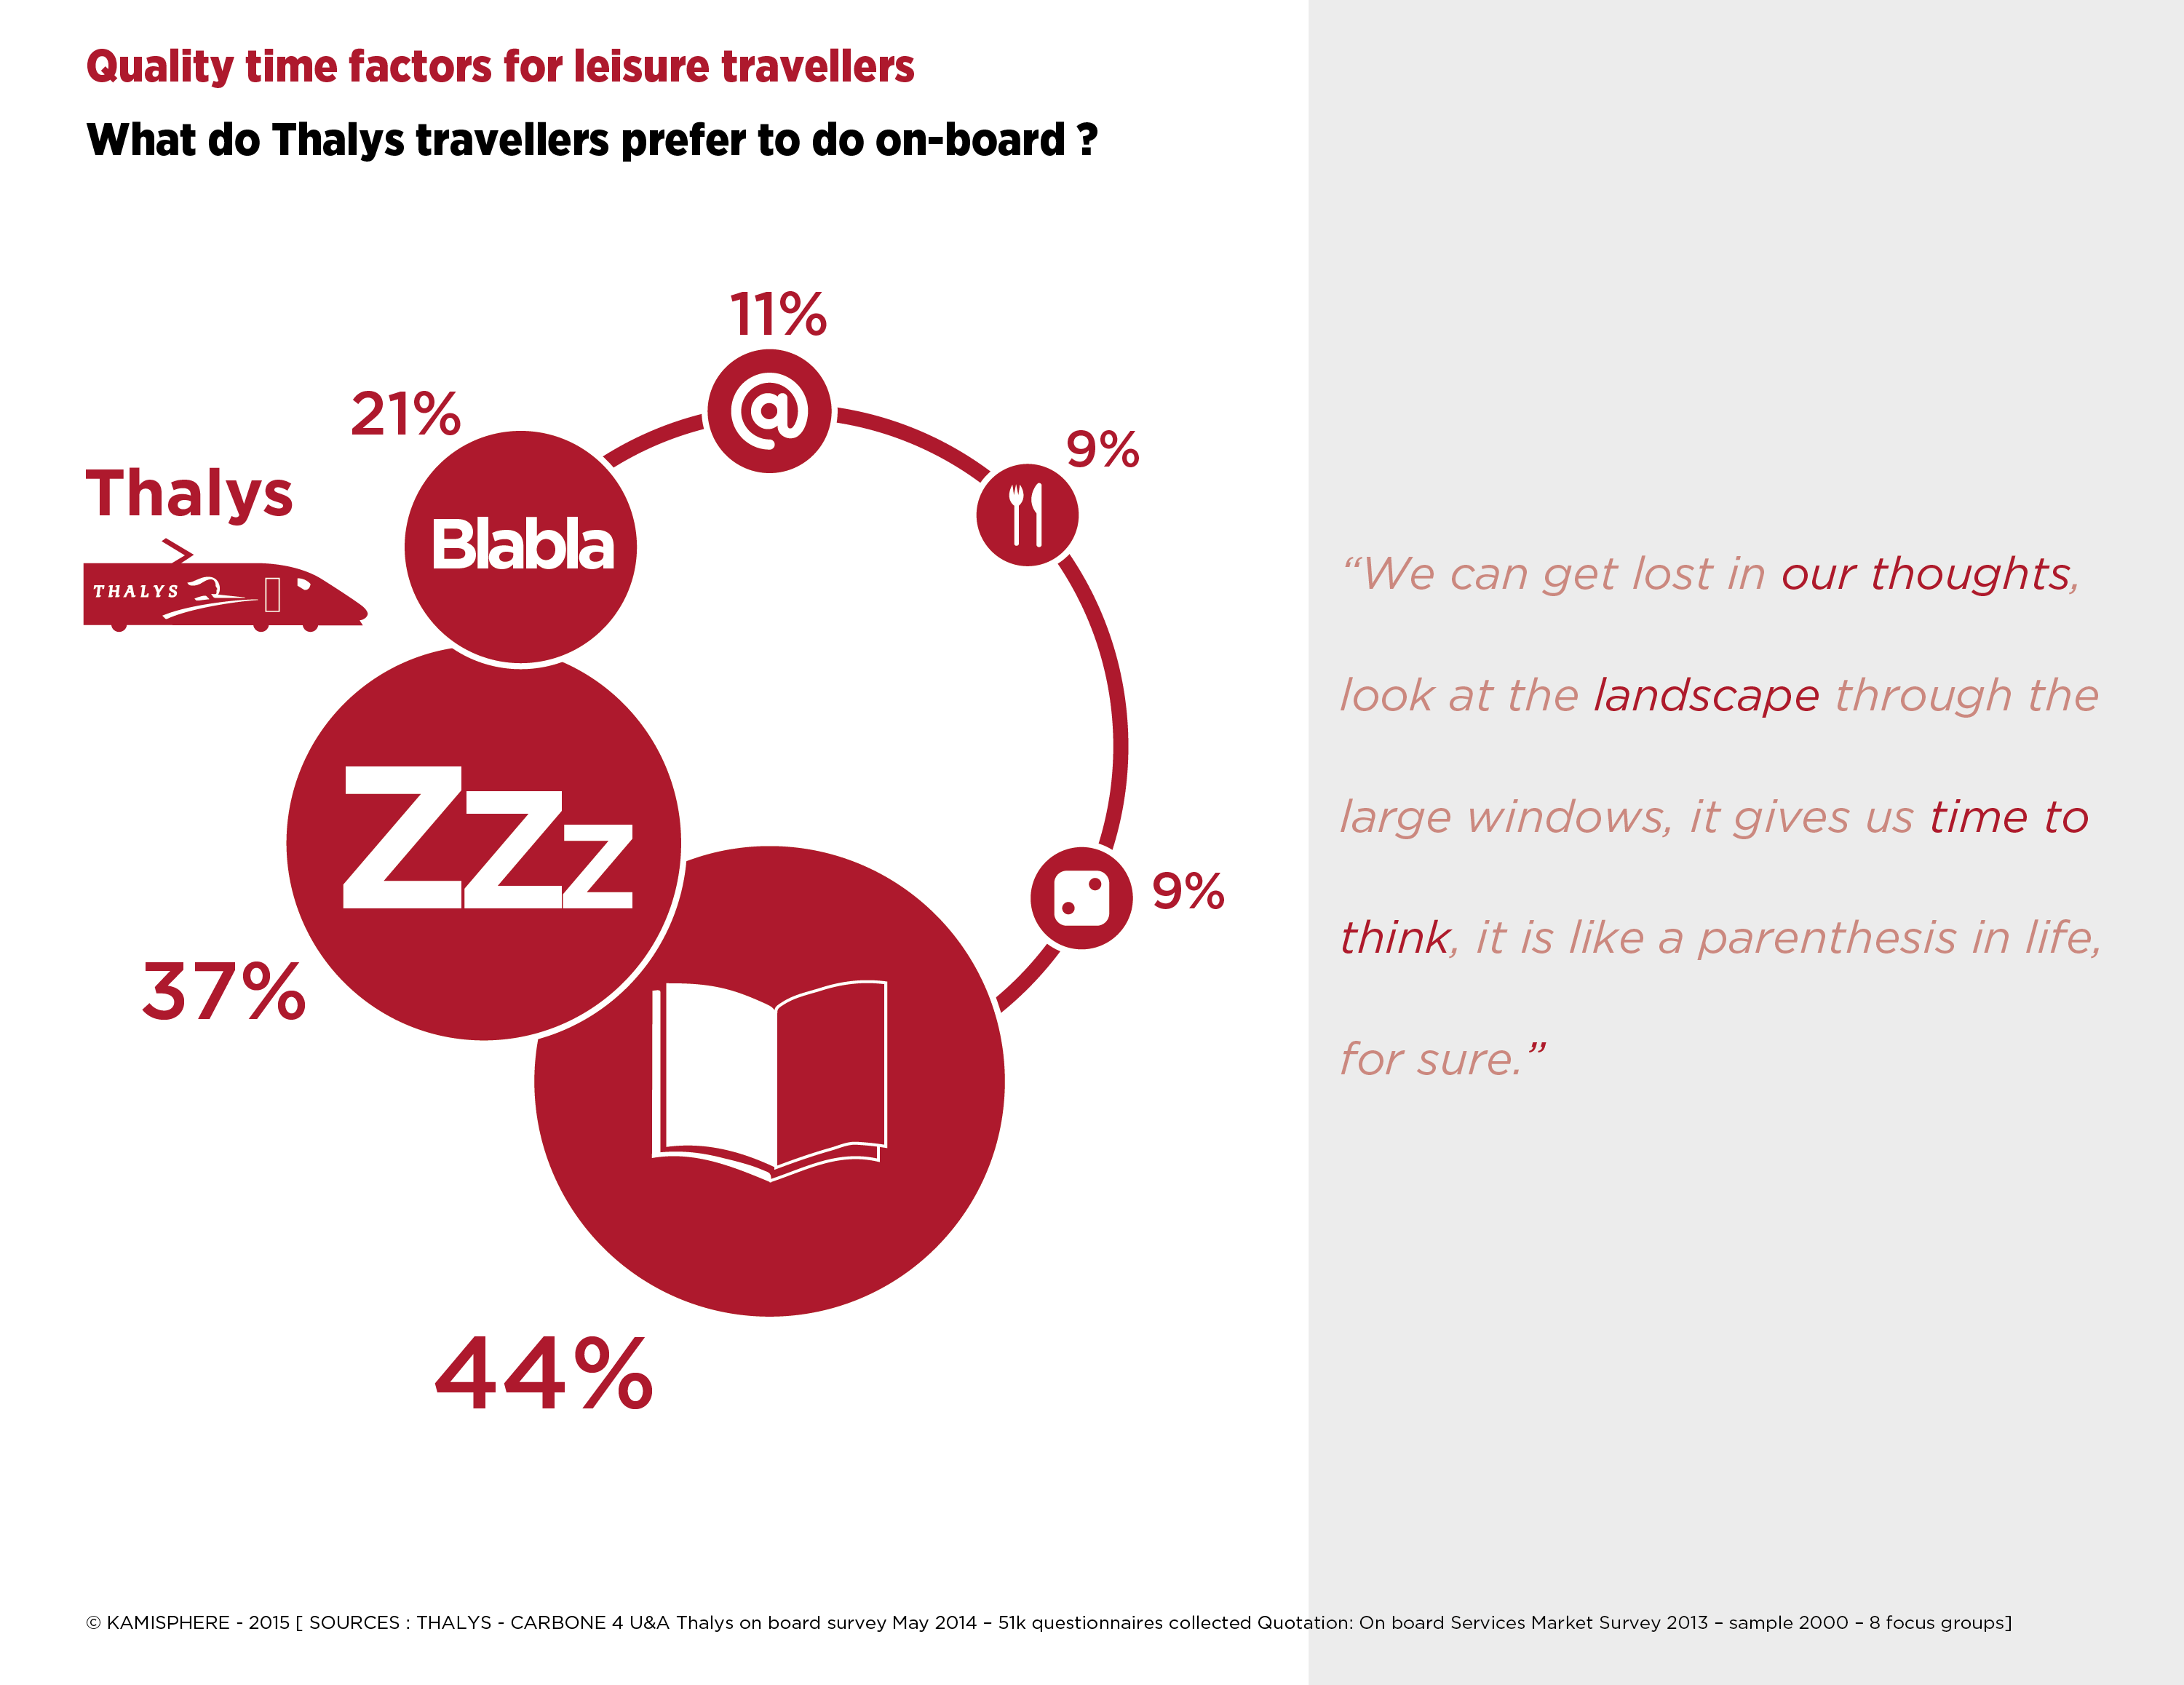
Thalys is as a great transport mode for business travellers. But it is also a great solution for leisure travellers considering they have many option to occupy their time during the journey. We designed an infographic based on a survey conducted by Thalys toward travellers. Apparently, time spent travelling is assimilated as personal time.
© Kamisphère
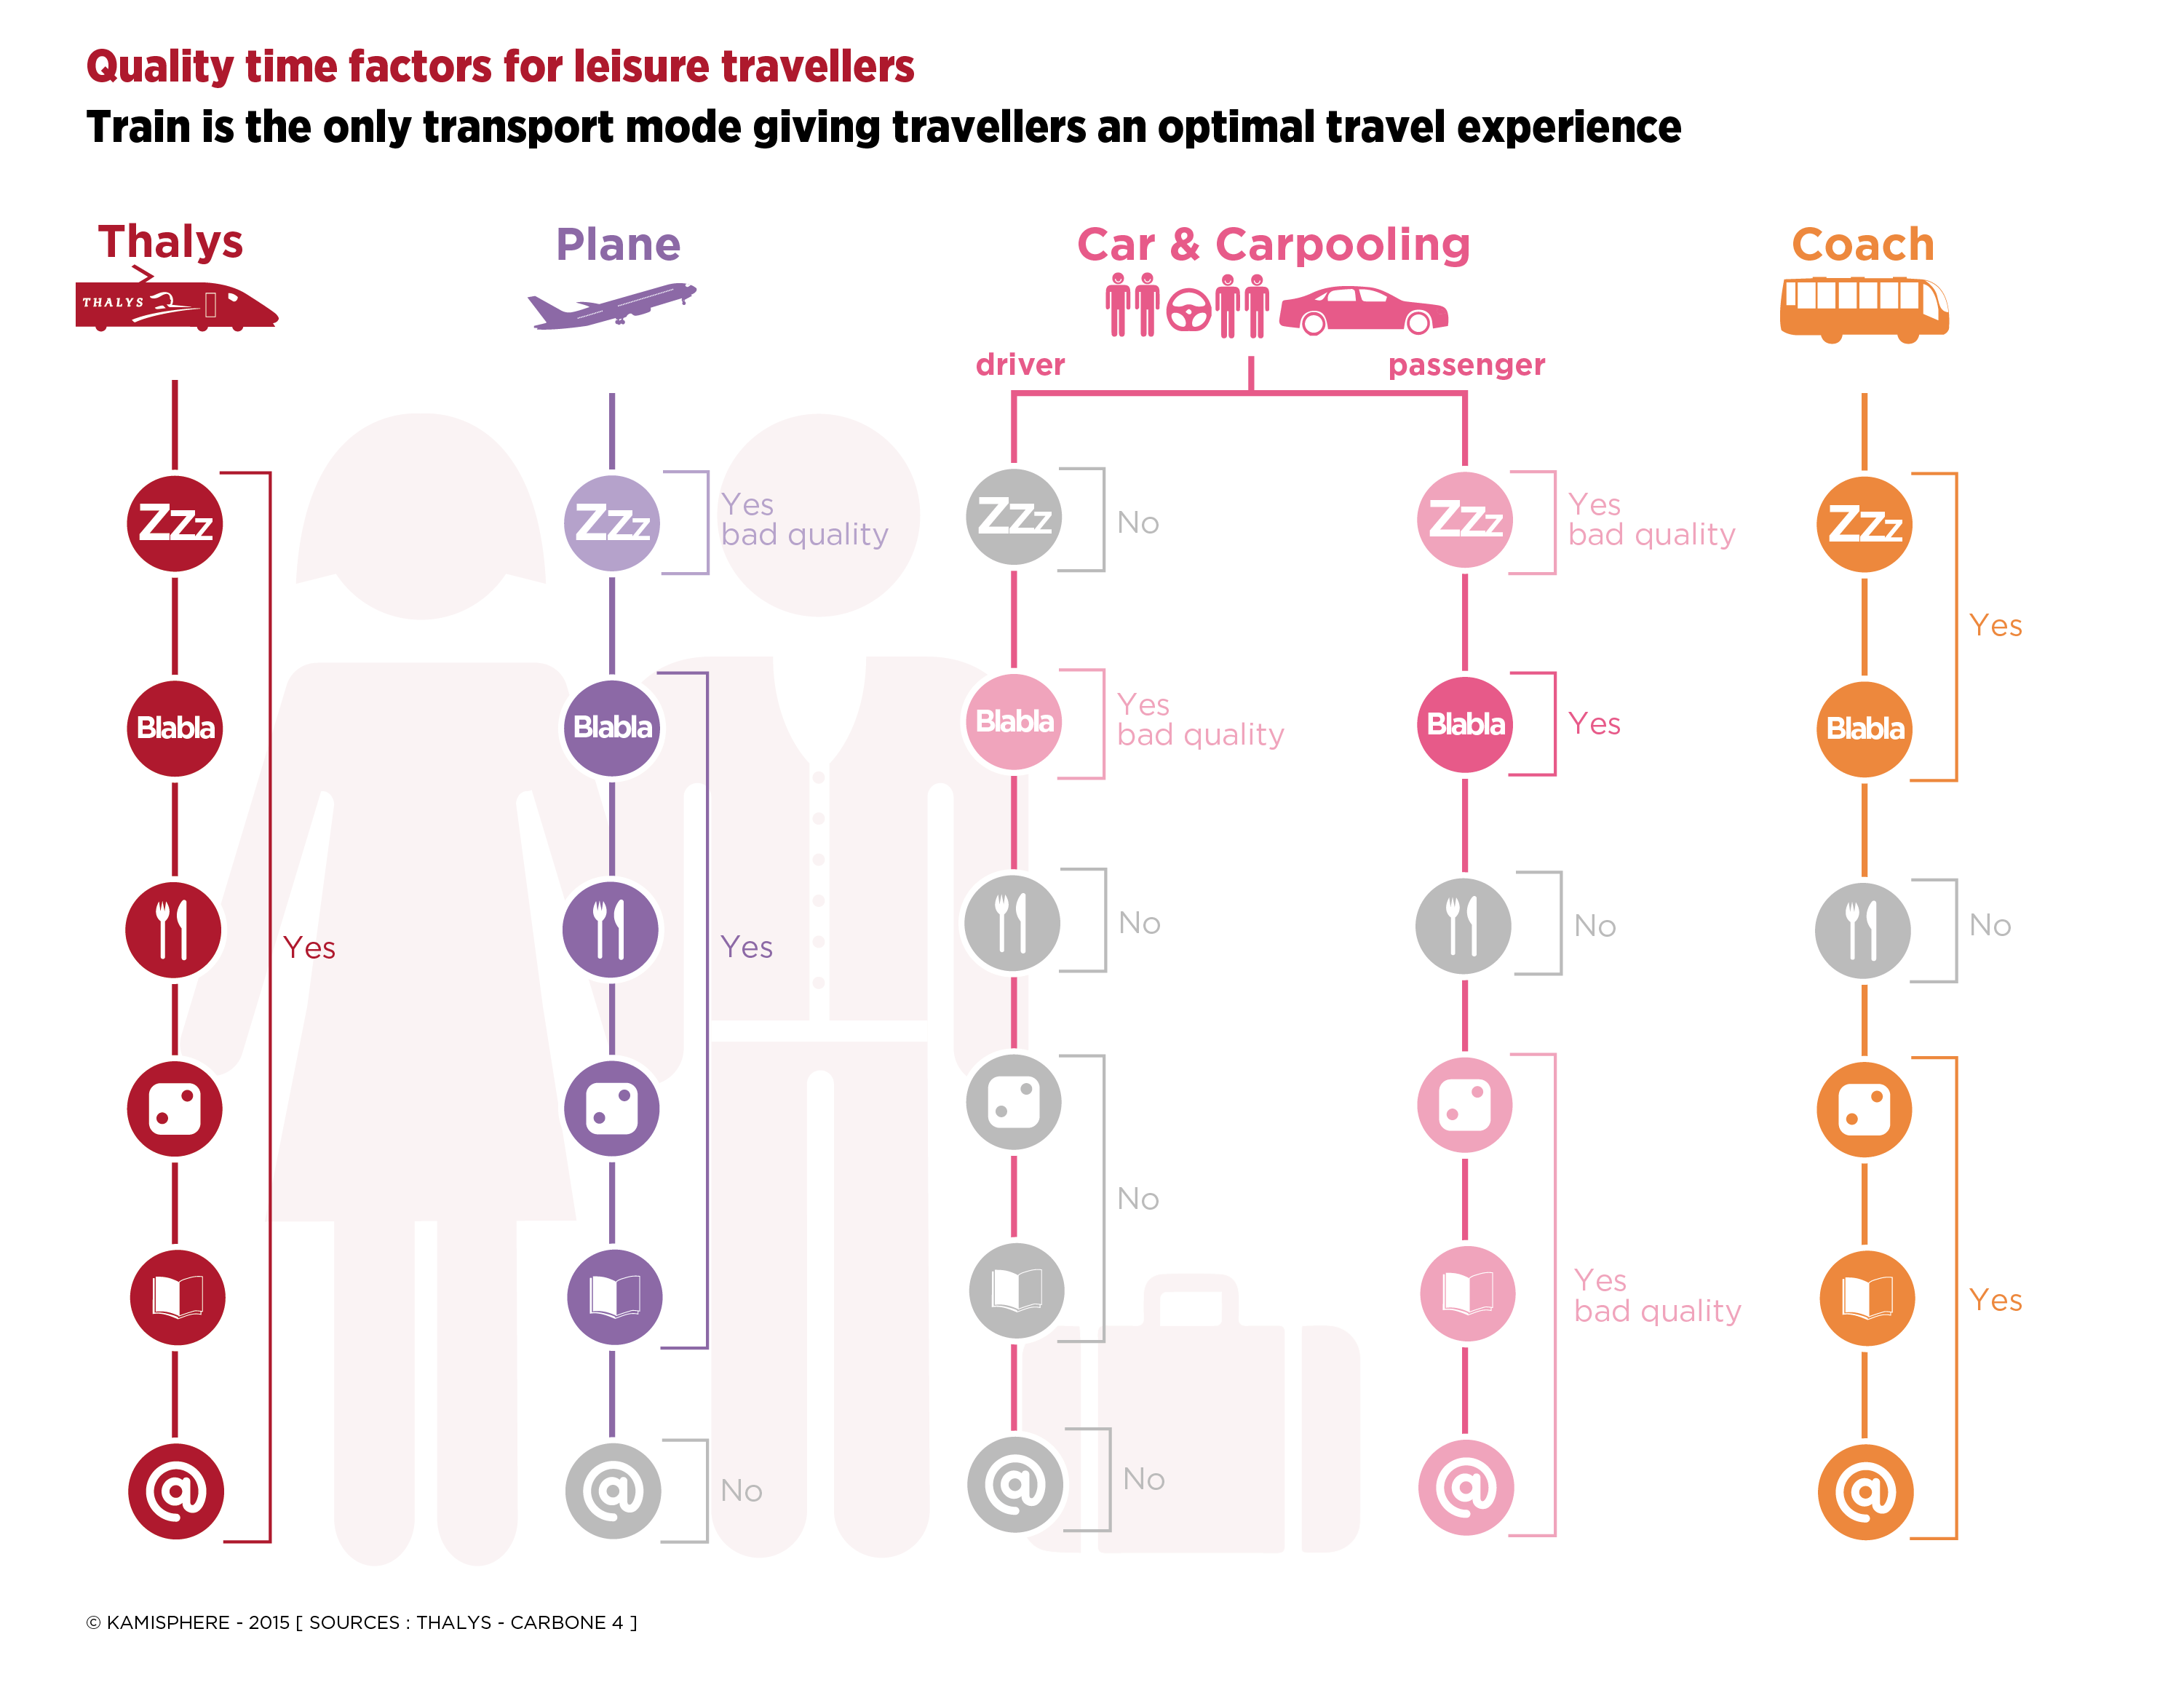
And, as the second infographic shows it, the more travellers have occupation possibilities the more they will appreciate the travel time.
Externalities
Last but not least, externalities. The report we worked on included a deep analysis of the sustainability of each transportation mode. Obviously each transport mode produce its own externalities that have impacts on the environment, the economy and the society. For this part of the report, we designed infographics which delivered powerful messages. The environmental and global warming issues have to be considerate by everyone who is travelling. Travellers and more generally people must understand that their choices have impacts on the environment.
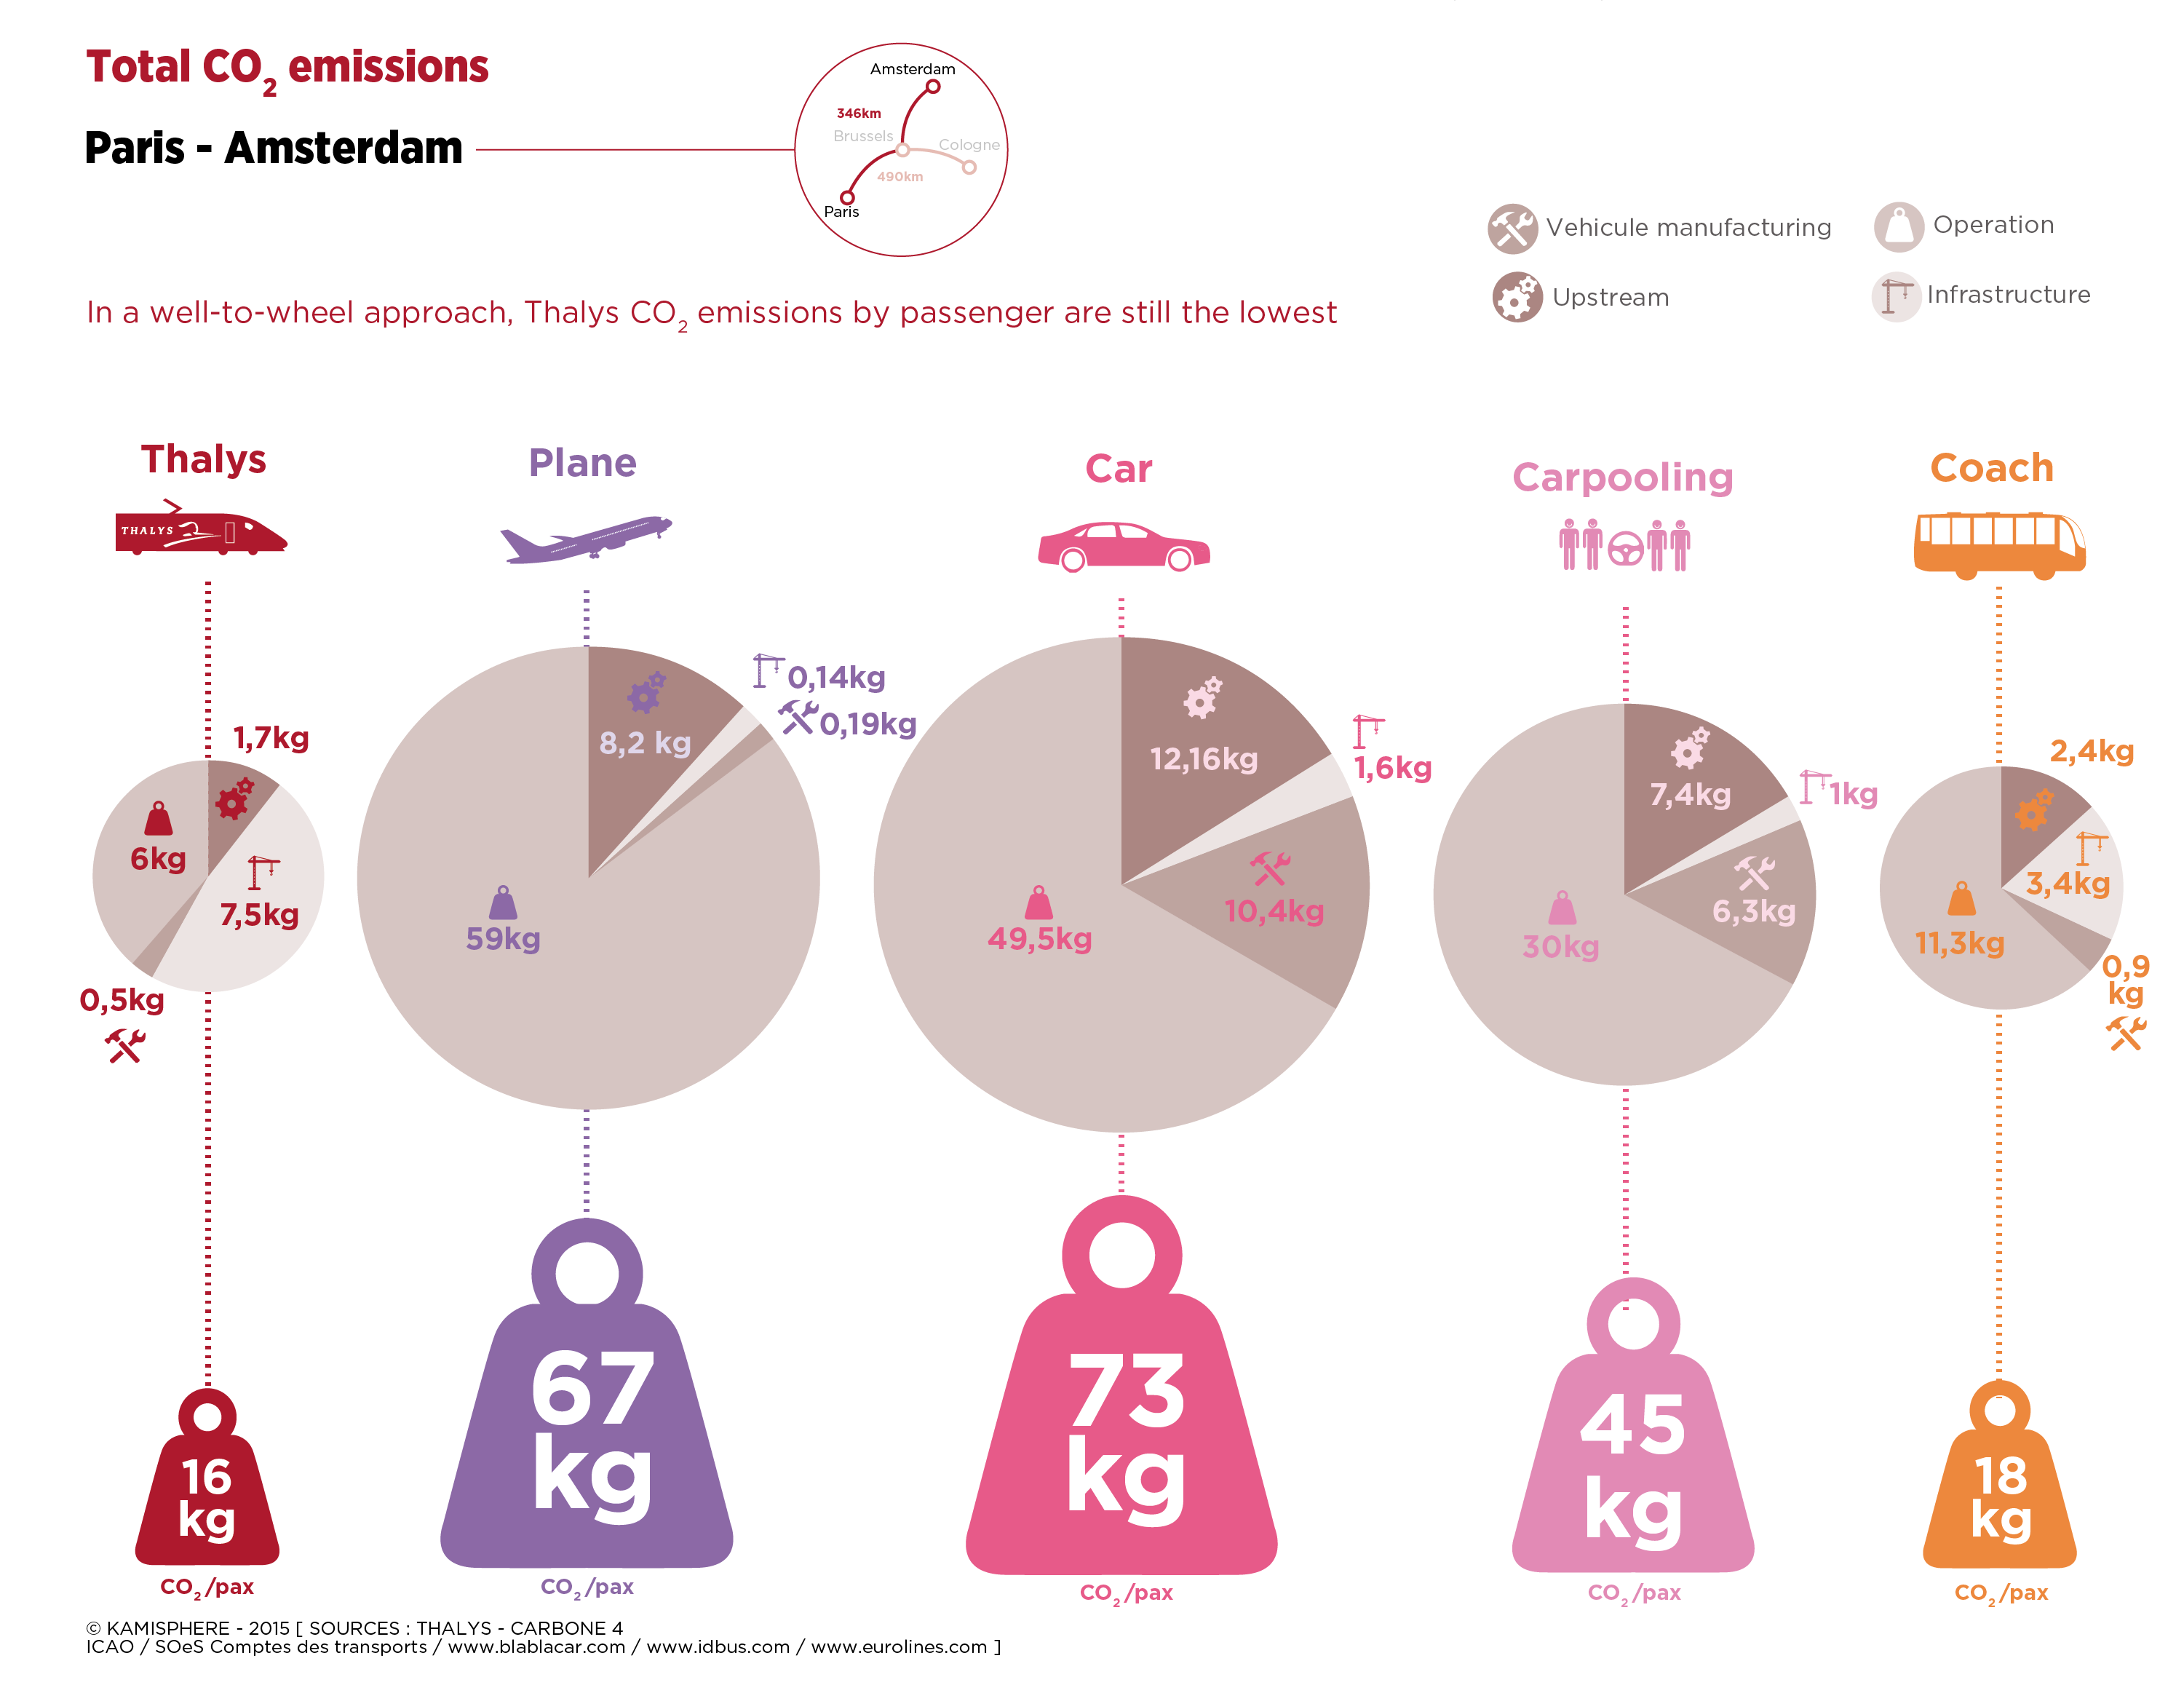
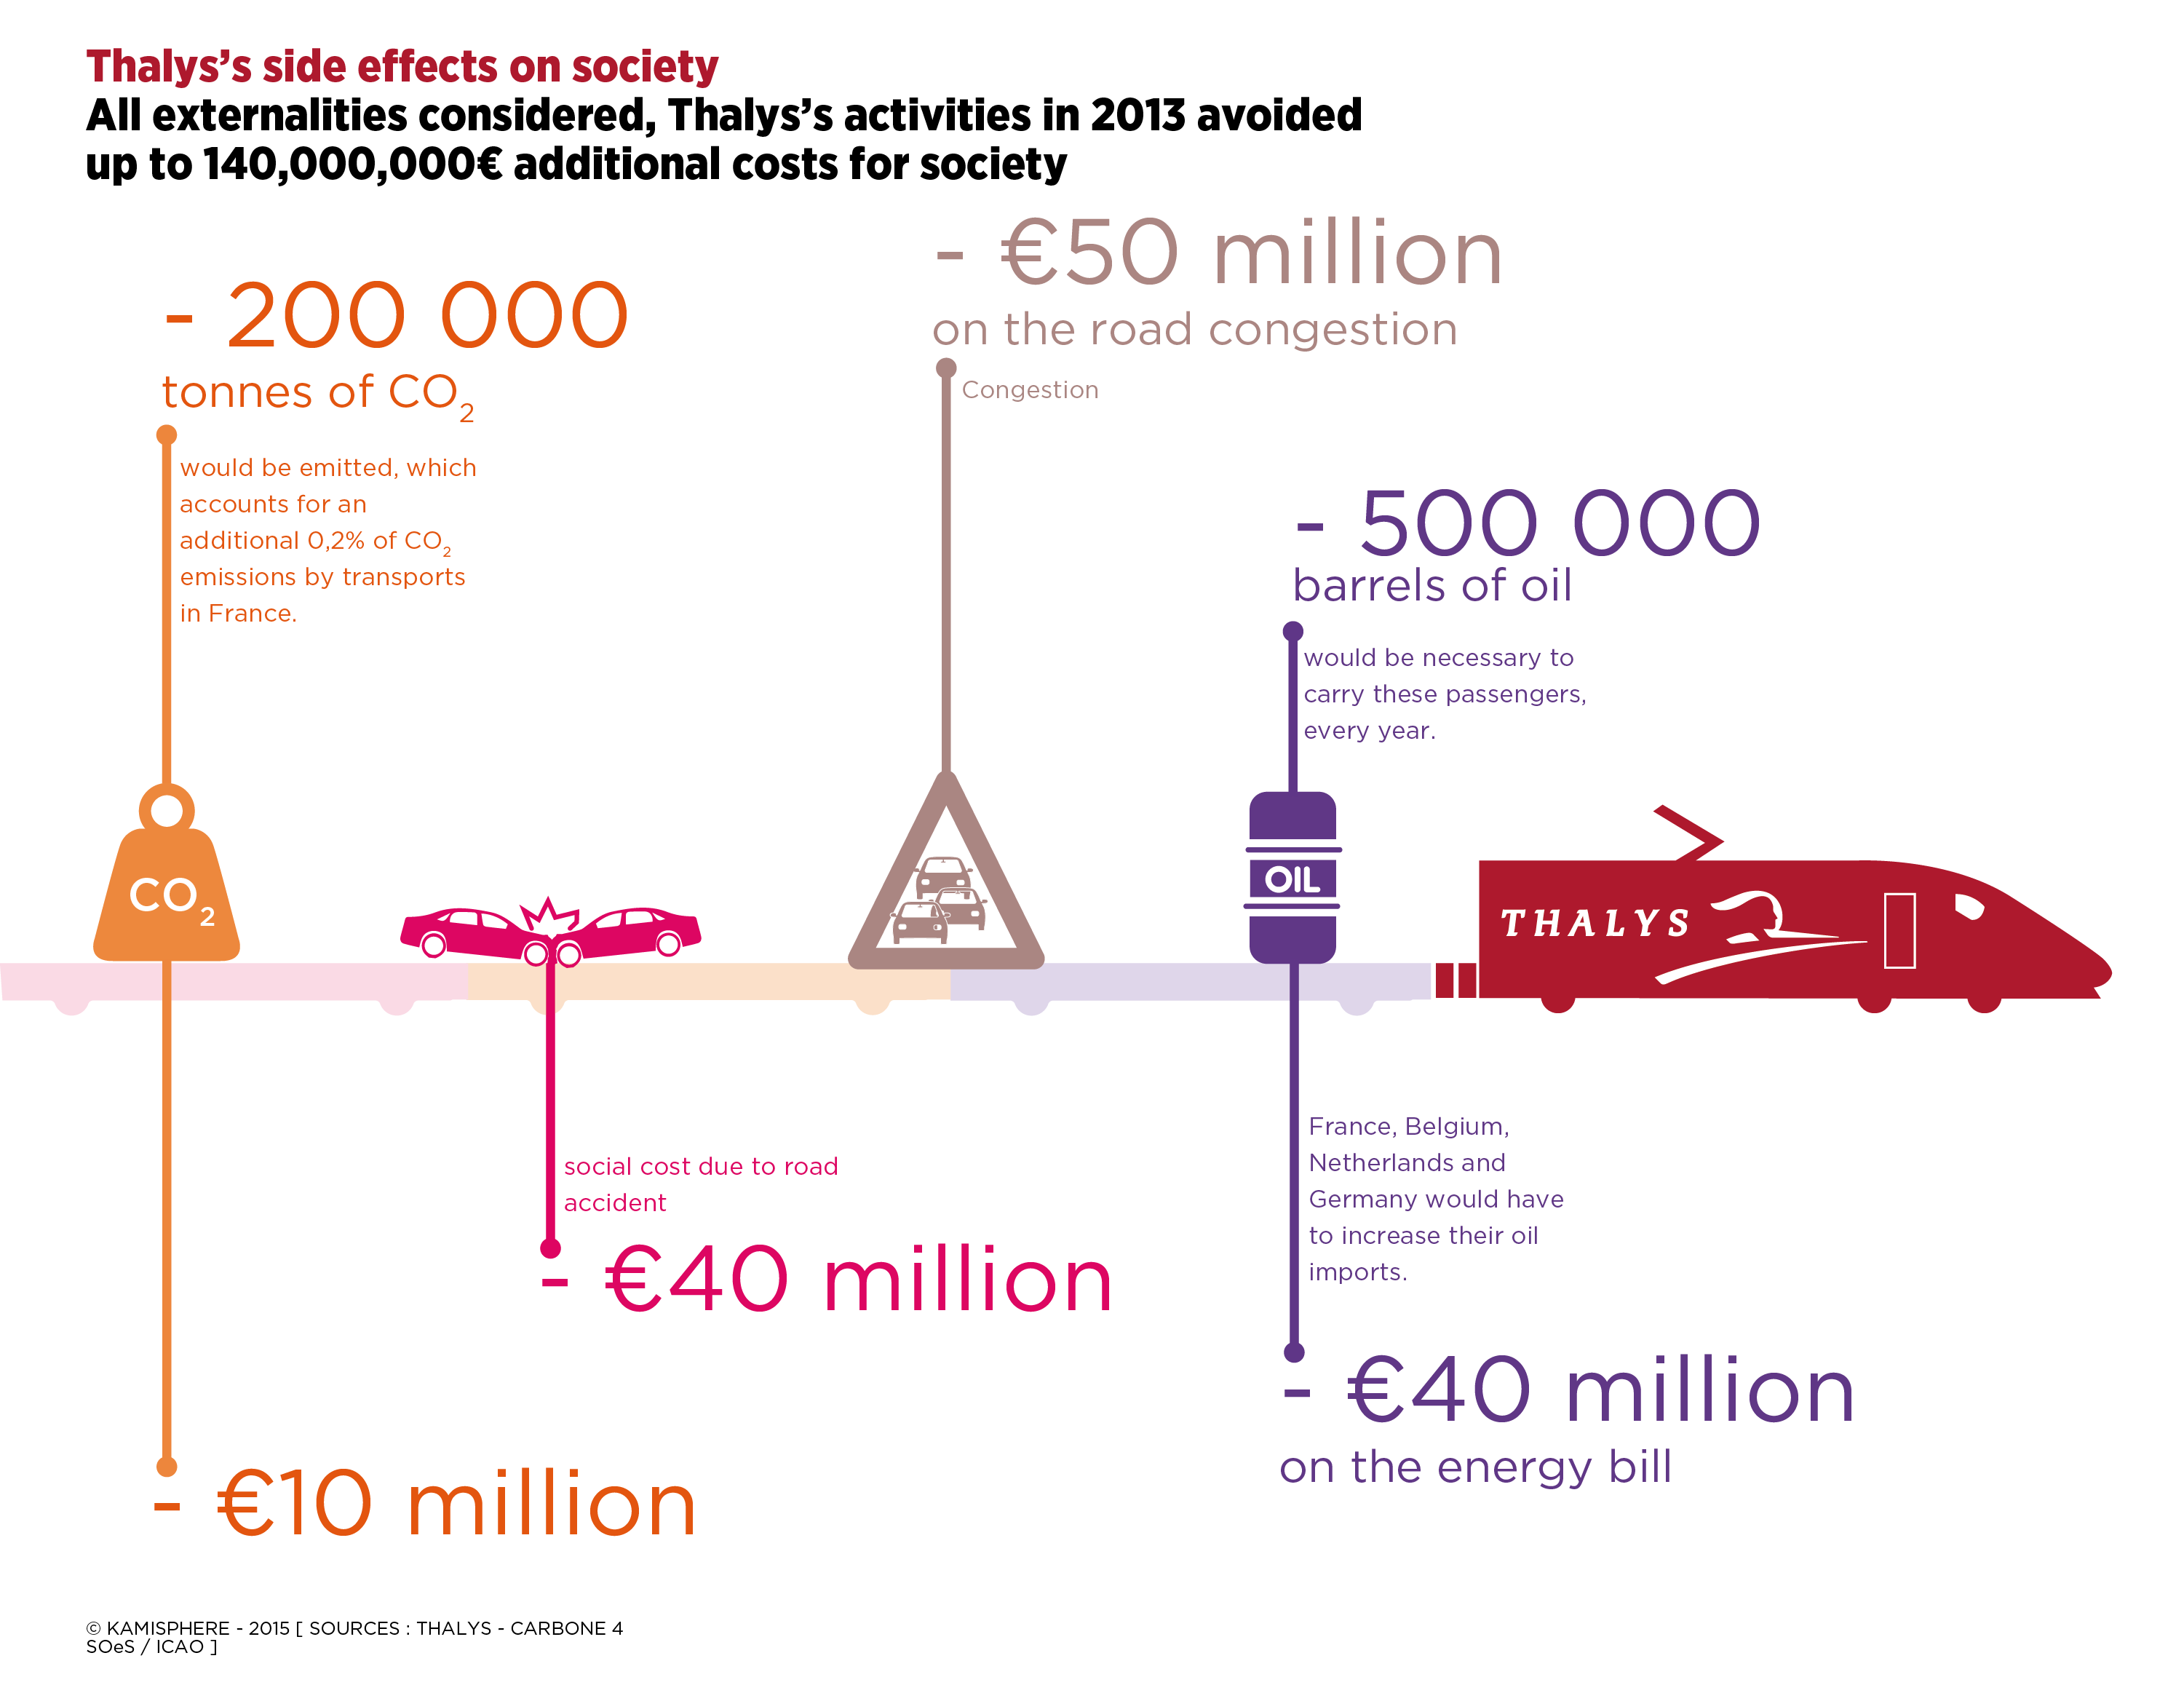
© Kamisphère
Thanks to Thalys and Carbone 4 !